


Automation Analytics: Understand and improve your Control-M workload automation
Visualjob for Control-M aggregates the scheduling definitions and job run-time statistics of your Control-M environment and visualises the result in an understandable and meaningful way.
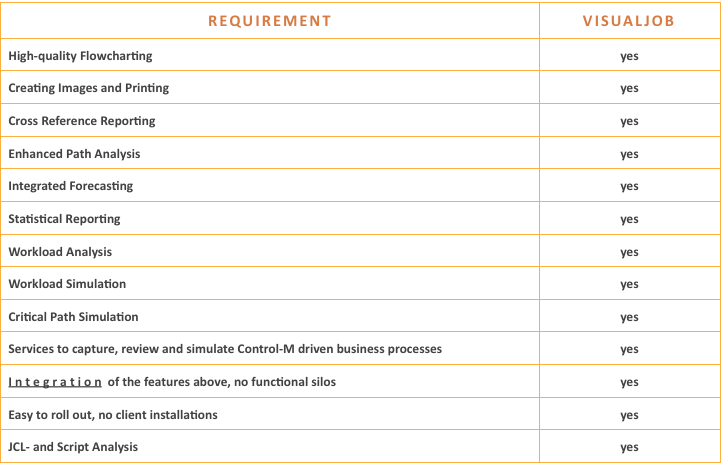
All aspects of high-quality flowcharting, cross referencing, forecasting, quality assurance, statistical reporting, critical path analysis and critical path simulation for Control-M are available within one integrated solution.
All aspects of high-quality flowcharting, cross referencing, forecasting, quality assurance, statistical reporting, critical path analysis and critical path simulation for Control-M are available within one integrated solution.
|
|
Automation experts and Analysts can now gain reliable information and perform root-cause analysis and workload simulations quickly, replacing labour-intensive information gathering and professional estimates. Visualjob for Control-M is the most advanced Automation Analytics solution for Control-M available today and is essential for the effective management of your Workload Automation environment. Via visualjobcontrol, which is part of the visualjob for Control-M license, JCL and script analysis is also provided. |
Meaningful metrics within everyone's reach
Metrics about your Control-M environment, collected and aggregated by VISUALjob can also be visualised via the APS Analytics Dashboard.
VisualJob for Control-M Features
Flowcharting
visualjob for Control-M provides managers, production staff, applications personnel and end-users with an integrated graphical overview of the Control-M job network that is unmatched. Complex relationships between jobs are presented in an easy and understandable visualization, not only reducing the time it takes to understand the existing environment, but also pinpointing potential problems and avoiding costly downtime. All Control-M for z/OS and Distributed Systems parameters are supported.
Creating Images and Printing
Creating Images and Printing
Creation of high quality graphics, printouts, PDFs and input for Microsoft Office and VISIO facilitate accurate communications between interrelated departments and better documents the business processes that Control-M supports.
Cross Reference Reporting
Information about Control-M definitions that previously took hours to produce, or was simply unattainable because of complex relationships, can be generated in seconds without requiring third party products, individual scripting, proprietary skills or production resources. Users focus on the reporting objective, as opposed to the process of achieving that objective.
Enhanced (Critical) Path Analysis
In order to understand and analyze a Control-M job net correctly, it is critical that the various paths can be identified quickly and accurately. The path search option of visualjob for Control-M can identify and display the Control-M paths from and between a start and/or end job. Combining the path search with the forecast function or the knowledge about how jobs have executed in the past makes the enhanced (critical) path analysis a unique and very powerful assistant.
Forecasting
Errors can lead to disruptions and delays in production. In order to visualize the schedule or discover possible planning mistakes while designing the job net, visualjob for Control-M provides robust forecasting functions. visualjob for Control-M can forecast at any level, from the individual job or the entire schedule. The forecast can be performed for a specific day or a range of dates. The output can be a flowchart, Gantt chart or spreadsheet.
Statistical Reporting
Free form reports can easily be generated utilizing statistics from past Control-M batch executions collected in the visualjob for Control-M statistical database. Robust filtering criteria can be used to narrow the focus of reports based upon criteria such as dates, times, job, node id, job status, completion status, day of week, and more. No programming or SQL knowledge is required. Reports can be saved, reused and generated in an automated way, saving a lot of time and effort in producing this intelligence.
Workload Analysis
visualjob for Control-M enables the user, based on the known job net definitions and the runtime information collected in the statistical database, to visualize past Control-M job executions in a Gantt diagram called GanttView. This provides an excellent graphical overview about what has happened in the past and is an essential key for root-cause analysis.
Workload Stimlulation
Predicting future job runs based on realistic statistical information and past experience is a constant challenge. visualjob for Control-M provides comprehensive workload simulation functions with graphical support through the GanttView to perform effective resource utilization and proactive analysis. With predictive analytics, professional guessing is now replaced by an accurate process ensuring that future service level agreements (SLAs) will be met.
Services
A Service is a Control-M driven business process which can be defined and uniquely named by a visualjob for Control-M administrator. The visualjob for Control-M users can call these Services and perform automated root-cause analyses (Automation Analytics) and Workload Simulations with only two clicks.
JCL & Script Analysis
Via visualjobcontrol, which is part of the visualjob for Control-M license, JCL and script analysis is also provided. visualjobcontrol is the most up-to-date, easy-to-use, fastest way to view, analyze and report on JCL.