


|
Statistical Reporting |
|
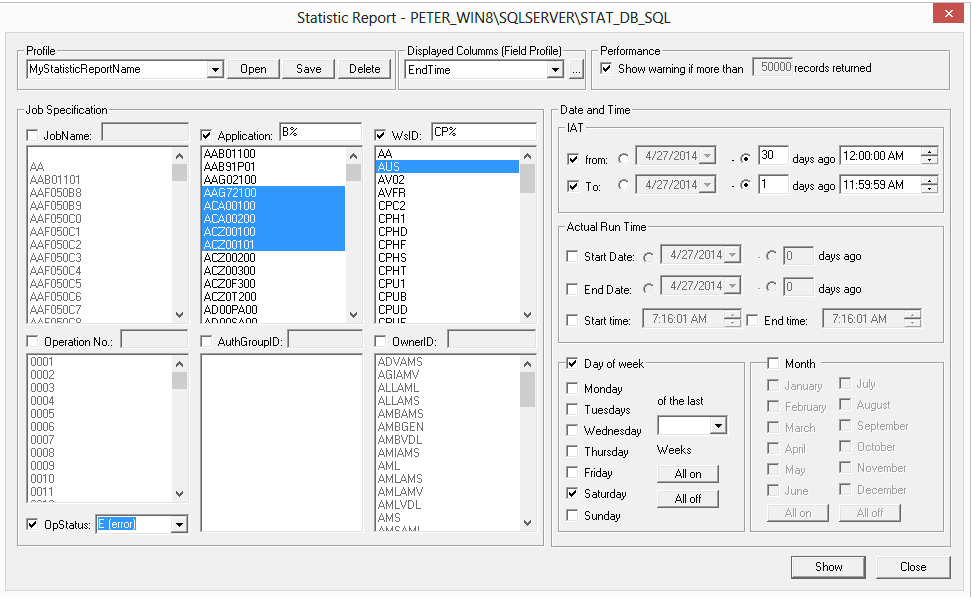
Just like VISUALjob for TWS´s Cross Reference Reporting facility statistical reports are generated without the use of third party products, individual scripting, proprietary skills or production resources.
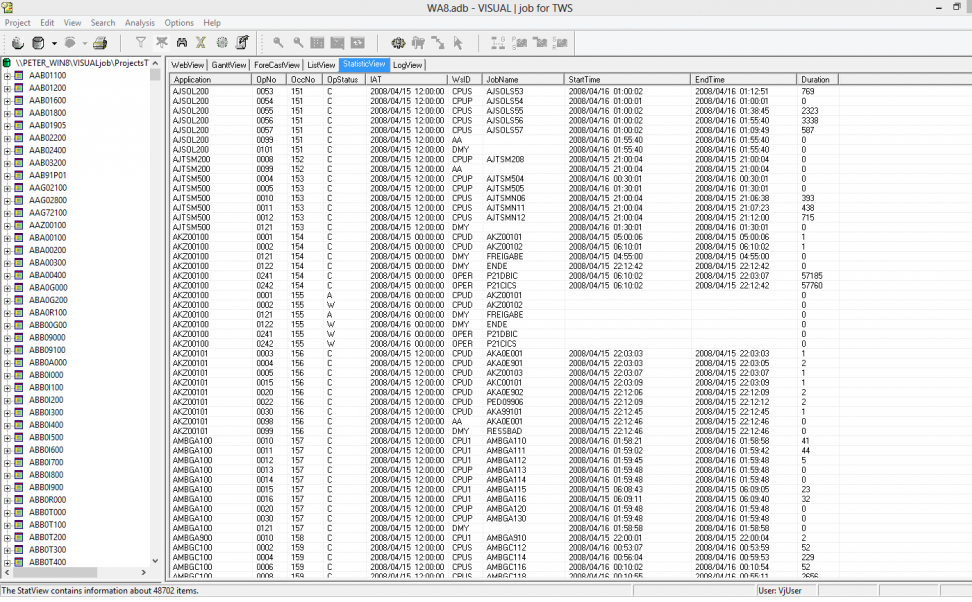
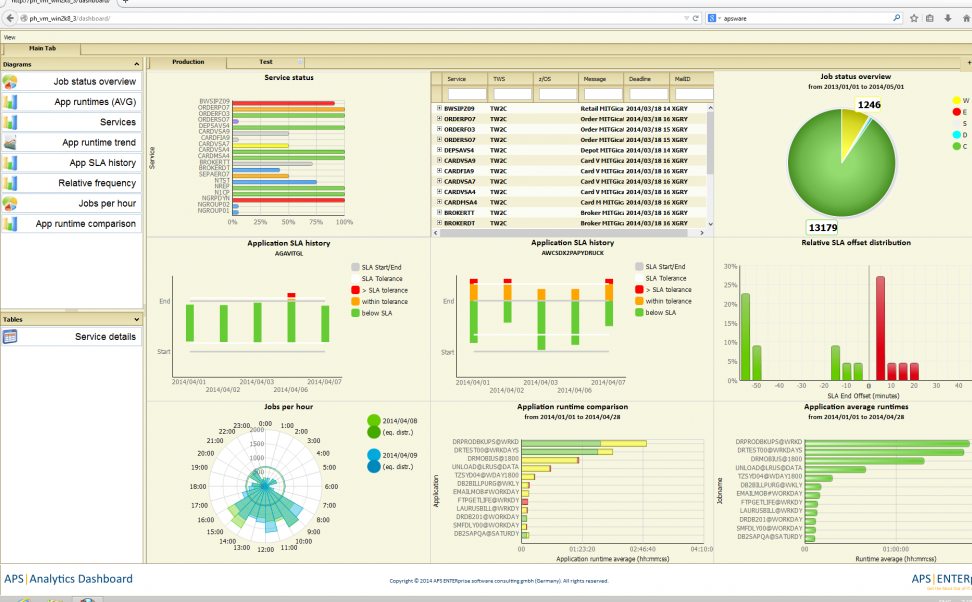
VISUALjob for TWS Statistical Reporting answers questions such as “What were the run times of specific operations for a specific period of time?” or “What operations have executed on a particular TWS Workstation last Thursday?” All statistical reports can be exported to Microsoft Excel format or text format. The generation of the statistical reports and distribution via email can be executed in an automated way. The increasing demand for regular status information about important jobs from technical users and business users can be clearly fulfilled and its execution can be completely automated with VISUALjob for TWS. Statistical TWS job runtime information can also be provided in a graphical Gantt chart via the VISUALjob for TWS Workload Analysis. Metrics about your TWS environment, collected and aggregated by VISUALjob can also be vizualised via the new APS Analytics Dashboard. |
|