


|
Workload Analysis |
|
With its workload analysis capabilities VISUALjob for TWS answers the following questions for you:
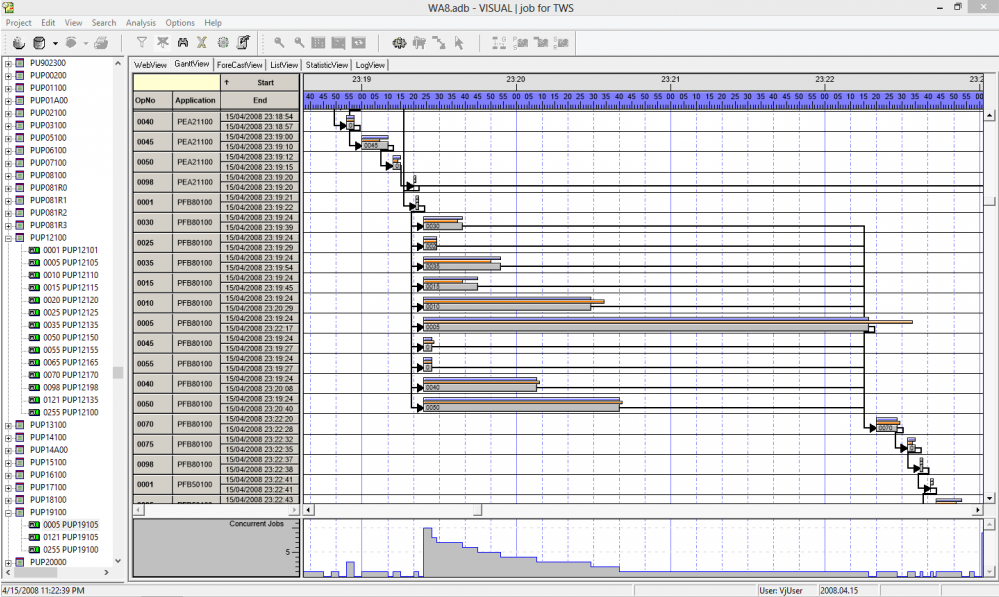
Within the GanttView all operations or a selection of operations are shown against a timeline and in relation to each other, allowing you to see exactly how they have affected each other for a specific production run. Timelines indicate a operations run and that operations expected duration estimated by TWS, allowing you to have an immediate comparison. A histogram showing the number of operations running in parallel provide a complete overview, which is otherwise difficult, if not impossible, to gain. Bottle-necks and other potential problem areas can be identified and the required actions to avoid these problems can be made in a proactive way. |
|