


Workload Automation Analytics made easy
The aps analytics dashboard provides strong automation analytics and batch reporting in a way you have never seen before. No subject matter expertise about your Control-M or TWS / IWS workload automation solution is required. You just use one of the many predefined report types, a wizard assists you in defining your key criteria and the aps analytics dashboard will deliver the required reports to you instantly. Through meaningful visualisation, you will understand immediately. The aps analytics dashboard delivers optimised business decision support metrics you need, so you can more effectively manage your workload automation processes.
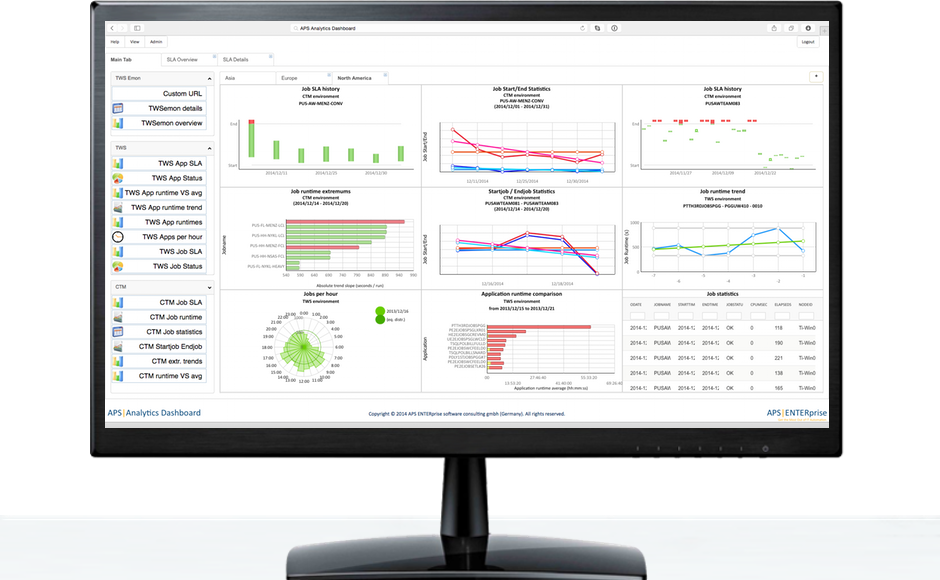
Meaningful metrics within everyone´s reach
The aps analytics dashboard complements the innovative workload analytics and root cause analysis capabilities of visualjob for Control-M and visualjob for TWS.
Real time monitoring and reporting is also supported for TWS / IWS by twsemon and extended via the browser for any level of IT and management.